
“No one who has experienced the intense involvement of computer modeling would deny that the temptation exists to use any data input that will enable one to continue playing what is perhaps the ultimate game of solitaire.”—James Lovelock, “Gaia”
“Prediction is very difficult, especially of the future.”—Niels Bohr
INTRODUCTION
We keep reading and hearing “Science (uppercase obligatory) shows…” with respect to politically correct views on the Wuhan flu, anthropic global warming, racism, economic oppression, etc….. “Believe the science.” Horse Hockey!!! Almost invariably it isn’t a scientific analysis that’s being cited but faux science, computer programs using statistical projections that have the desired conclusions built in.
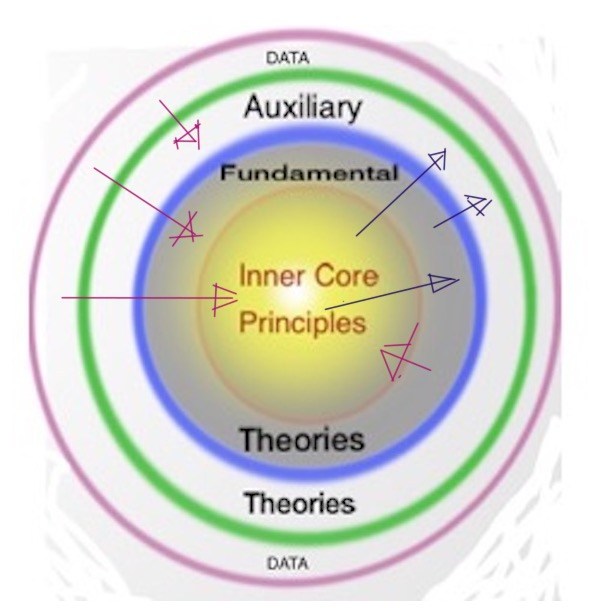
But such computer modeling isn’t science. Science requires empirical tests of hypotheses such that predictions can be tested: the hypotheses are to be falsified or verified by repeated empirical demonstrations. Besides fitting data, the hypotheses must coordinate with general and subsidiary principles of science. The best representation I’ve found for how science works is the “Lakatos Scientific Research Programme,” diagrammed in the featured image above. There is an interplay—predictions, correlations, feedback—between the shells of a sphere, fundamental principles, fundamental theories, auxiliary theories, data. A more detailed description of this is given here.
As with other mathematical tools employed in scientific endeavors—calculus, linear algebra, group theory, topology, Feynman diagrams—computer programming may be accurate, but would not have intrinsic truth value. The truth value comes from measurements, replicable in many labs. That’s how science works. (See here.) It takes more than one “successful” prediction to validate a computer model, and it takes only one unsuccessful prediction to show that it’s worthless.
In this article I’ll first give a very brief background summary of the math involved in epidemiological predictions (models) and point out problem areas. I will then focus on one article that has been cited as support for restrictive measures in the pandemic and show how the predictions put forth in the article were not met, and why, therefore, this was not “science.”
THE MATH OF EPIDEMIOLOGY
(This section can be skipped by mathphobes.) The basic parameter used in epidemiological models is R0, the “reproduction number,” which can be defined as
R0 = τcd
Here,
- “τ” is the “transmissibility, the probability of infection given contact between infected and non-infected individuals;
- “c” tells how often infected and non-infected individuals come in contact, i.e. the rate of contact;
- “d” tells how long the infected individual is infected, i.e. the duration of infectiousness.
It should be clear that there’s a great deal of leeway and ambiguity in assigning values to any of the parameters in R0. Indeed, the possibility of errors in interpreting or estimating R0 is well recognized, as shown in the quote below:
“The interpretation of R0 estimates derived from different models requires an understanding of the models’ structures, inputs, and interactions. Because many researchers using R0 have not been trained in sophisticated mathematical techniques, R0 is easily subject to misrepresentation, misinterpretation, and misapplication.”—Paul L. Delamater et al, “Complexity of the Basic Reproduction Number (R0)”
To expect that any of the parameters—τ, c, d—can be represented by just one number is, I believe, an oversimplification. To expect that these numbers will stay constant during the course of an epidemic, given the possibility of virus mutation and mitigation factors, is also an oversimplification. I recommend Delamater’s article for a full account of all the factors that can make R0 variable. Nevertheless, other auxiliary theories in science use simplifying assumptions and make successful predictions, so the outcome of predictions should be the test of whether a theory, implemented in a computer program, is valid.
A final note on the math: epidemiological modeling generally uses coupled linear 1st order differential equations and statistical methods for stochastic processes to generate predictions under various assumptions and for various parameter values. (See here and here for detailed accounts.) If one examines the papers that describe the mathematical techniques, it’s clear that outcomes can vary greatly depending on values assigned to parameters and on the choice of a particular mathematical model.
UNSUCCESSFUL PREDICTIONS FOR THE WUHAN FLU (COVID-19)
Note first that there have been many instances outside of epidemiology where computer models relying on statistical techniques have made predictions that didn’t come true. (The readers of this blog probably know of those dealing with effects of anthropic global warming.) More recently we have seen (here, here, here and here) how statistical analysis can be applied and misapplied to “data” for the Wuhan flu. Matt Briggs, “Statistician to the Stars,” has many articles on the misuse of statistics in this. I recommend his podcast for a general of account of how covid-19 data has been used and misused in statistical analysis.
In this article I want to focus on the “Report 9 from Imperial College Response Team.” Based on this report, politicians and pundits predicted dire consequences from the pandemic: total deaths, 2.2 million in the US, 510 thousand in the UK (Figure 1A, loc.cit.). When critics of the study complained that these extreme mortalities didn’t occur, Ferguson correctly responded that this would have been the totals had no mitigation efforts taken place. However, that isn’t really a prediction; it’s more like a street preacher with his sign that the world is coming to an end in one month. The preacher’s prediction might be true, but there’s no way of verifying it. There never was or would be a situation where no mitigation efforts were applied. That wasn’t even the case for the Spanish Flu epidemic 100 years ago.
Moreover, the deaths per day in Figure 1A go to 0 by September 1st, which has not been the case, mitigation or no mitigation. Further, if one examines Fig. 1B, cases per day for various US states, the curves are totally unrealistic in terms of how they vary from state to state and in their shape. Indeed, this is a general criticism of all the figures: the shapes show symmetric (or essentially symmetric) rise and falls for all mitigation scenarios, and that is not how the actual data, faulty as it may be, is displayed.
Here are some events that computer models have not taken into account. Forty-two percent of all deaths in the U.S attributed to covid-19 (notice “attributed to,” not “due to”) have been in nursing homes and assisted care facilities. In particular, these facilities have been in states where governors have directed nursing homes to accept covid-19 patients who were released from hospitals. Our neighboring county in Pennsylvania, rural and with a low population density, had a sudden spike in covid-19 cases at the end of August and beginning of September; the cause: partying in the local university. This latter spike in covid-19 cases is nationwide, wherever colleges have resumed in-person classes.
So, what are we to conclude? Is such computer modeling an exercise in using “any data input that will enable one to continue playing what is perhaps the ultimate game of solitaire?” I’ll concede that the Imperial College Report is an interesting speculation on how various mitigation programs might affect the transmission of covid-19, and in that sense it is a useful exercise, and the authors are to be commended for that effort. What I object to is the use of these computer projections by pundits and politicians to justify public health measures, because the measures are based on “science.” It isn’t science until the computer projection has made repeated correct predictions.
Here’s what might have been more helpful: applying the model to known data (e.g. South Korea, Taiwan), or if the report had been published later, Sweden, Italy, Spain and Germany, to see how well the modeling fits actual data. This would have been an exercise in retrodiction, which is sometimes useful science (e.g, explaining the anomalous perihelion precession of Mercury using general relativity). There wouldn’t have been as many headlines stemming from the report, but it would have been more of a scientific endeavor.


I’ve been keeping tabs of the IHME projections for a while and it’s apparent how artificial they are. The current models work by assuming that infections are primarily dependent on “mobility” which will instantaneously decrease when “mandates are re-imposed”. Mandates automatically occur when daily death rates get too high, and masks reduce the level of infection.
Now it’s apparent that this is not how the disease works, at all. Even if there are lockdowns we don’t have drastic decreases in “mobility” that remain constant over time, as can be seen in the IHME’s own cellphone “mobility” data. But the model pretends that this is what happens.
Keeping track over time, you can also see the numbers being fiddled with. Previously “mandates” would decrease “mobility” by about 40 percentage points, so say from -5% (from normal) to -45%. Now they change mobility by 65-80 percentage points. As infection is driven by “mobility” in their model, this makes “mandates” much more effective, with no actual change in observations.
Similarly masks have been made much more effective in the model. Previously there were some areas where “universal mask usage” led to more deaths than the “current projection” (including mandates) because the mandates would only be triggered with a sufficiently high death rate and masks slowed the increase of death rates just enough to allow it to remain just below what was required for a “mandate.” The IHME even had an entry in their FAQ explaining this behavior. Then one day suddenly the site changed from saying masks were “up to 30% effective” to saying “at least one third effective” and the decrease in infection rate with masks became much, much more noticeable in the models. They didn’t say in their updates exactly what they tweaked the effectiveness to, but it’s well over a third for the behavior in the model to work out the way it does.
At least they seem to have tempered some of their more ridiculous predictions. They predicted over 600,000 dead by the end of the year with “mandates easing”, now that’s down to about 450k (still ridiculous). Similarly at one point they predicted 120k deaths in Japan by Jan. 1, now it’s down to about 40k (for reference, there are currently about 1.4 k deaths attributed to COVID-19 in Japan).
For another example of a failed model, consider the University of Minnesota models used to justify the Gov. Walz’s policies. You can find a summary of their predictions here:
https://mn.gov/covid19/assets/MNmodel_PPT%205.21.20%201019AM_tcm1148-434753.pdf
What’s notable is that they actually ran different models depending on various scenarios, such as not doing anything or having various types of lockdowns and treatments. Their “do nothing” scenario was predictably ludicrous, predicting 42,032 deaths by the end of May!
But even their most optimistic scenario (lockdown extended past when it actually was, every accurate testing used to enact effective treatment) predicted 1,375 deaths by the end of May, a peak ICU demand of 2,444 and 22,589 deaths by the end of the year. Actual deaths currently are 1,435 and cumulative ICU usage is 2,049 (so needless to say there were never anything close to 2,444 COVID-19 patients in the ICU at any one time).
As you might imagine, none of the people responsible for making these models have been fired.
“Scientific” modeling is no different from any other type of modeling, such as financial modeling. The accuracy of the modeling depends upon three things (1) have you correctly identified the variables, (2) have you correctly formulated the relationship among the variables, and (3) are the inputs accurate/real. If any one of those items is off, the model becomes worthless.
RH, thanks for an insightful comment. I gave up two months ago following the “statistics,” because they were corrupt and meaningless. I’m not an expert in epidemiology calculations, so let me ask a question: is “mobility” the same as the parameter “c” in the equation for R0 or is it the product of tau and c?
C Matt, thanks for your comment. i agree with you. I argue that the modeling in itself is NOT science until the predictions (either for future or past) are verified repeatedly. If they’re falsified even once, then they’re not a valid hypothesis, or at the very least, a very limited hypothesis.
Up to this point my analysis of the IHME has mainly been speculation based on their output, since they had not made available an article detailing their current model. It looks like they did post an article since the last time I checked, which is available here:
https://www.medrxiv.org/content/10.1101/2020.07.12.20151191v1.full.pdf
(Side note: I always get a kick out of the “not certified by peer review” disclaimer at the top of medRxiv).
Since I just found out that this was available, I haven’t had time to read through it in detail. Doing a search for “mobility” the most I could find was that it affects a variable beta which changes over time “as human behavior shifts over time (e.g., changes in mobility, adding or removing SDM, changes in population mask use)”. This is later said to model the contact between individuals, so I guess it would be “c” in your equation. However beyond saying that they used fitting algorithms to determine beta, I can’t find any more information on it. Numerous remarks are made to a separate supplementary information document, which is not available on the IHME website.
However if you view the predictions themselves it is clear that mobility is driving the infections. Sudden drops in “mobility” caused by “mandates” have an immediate and large effect on the number of infections, with usually a huge, almost vertical, drop at the beginning of the “mandate” followed by a slower but steady drop afterwards. If you go through their data make sure to look at it at the lowest adminstrative level (such as state) since higher levels are obtained by adding the lower levels, and thus the relationships between the terms are obscured due to mixing areas with different behaviors.
RH, I’ve gone to the link you gave and I have to confess that this bear of very little brain can’t make heads or tails of it… I don’t see where the math is, what the predictions are and what presumed data might be. But that’s probably my fault. In any case, I don’t see anything there to negate my belief that “it’s not science.”
RH, trying to find out about mobility, I looked at an article in Lancet (see here:
https://www.thelancet.com/journals/laninf/article/PIIS1473-3099(20)30553-3/fulltext)
A study of mobility patterns (using mobility in its convention sense–moving from place to place) and covid-19 infection was made for several counties and strong correlation coefficients were found. here’s why it’s a ng study: all the counties cited were either urban or bedroom counties, so there would be effects of other variables–population density, income level, ethnic distribution that are probably strongly correlated with “mobility.” I’m surprised a referee didn’t catch this.
It looks like all the heavy lifting math is in another document which they didn’t give us access to. All those few equations towards the end, and they don’t even explain what all the variables mean.
But it’s still better than the situation was for weeks, where they put up a model we were all supposed to use with no explanation for how it worked whatsoever.
Computer models are often crap. That’s why Adm. Rickover insisted on building full scale prototypes of new reactors designs before trusting the lives of sailors to them. Two examples:
Example 1: sodium cooled reactor. All the best modelling said that a sodium cooled reactor would provide higher thermal efficiency, more power output and greater speed that a pressurized water reactor. So it was prototyped at West Milton but simultaneously tried on the old USS Seawolf (SSN-575). What a freaking disaster! Sodium leaks in the super-heaters after the steam generators required bypassing them and all thermal efficiency was lost. Besides, you know what happens when sodium contacts water? In a steel tube 1000 feet beneath the surface? Adm. Rickover abandoned that idea quicker than snake snot and the sodium cooled reactor in containment sphere in West Milton, NY where I went to prototype training was replaced with a three loop pressurized water reactor that actually worked.
Example 2: Navy Modifications and Additions to a Reactor Facility (MARF, otherwise known among us sailors as BARF for BS Additions to a Reactor Facility) was another worthless innovation design that all the best models said would work. It eliminated hafnium control rods (with complicated control rod drive mechanisms atop the reactor pressure vessel) with gadolinium tubes which when flooded with water would absorb neutrons to stop fission, and when evacuated would allow neutrons to be absorbed by the fuel to increase fission. Problem was – submarines do angles and dangles, so water level would change all the time. Imagine what that does to reactor power: screaming up to thermal limits then bottoming out below the point of adding heat. Even at the land based prototype water level could never be controlled tightly enough to prevent power oscillations, and freaking xenon transients made things all the more unstable. That idea, thank God and Adm. Rickover, never made it to a submarine.
Trust me on this: if there is a dumb idiot model out there for ship propulsion or electrical generation, then the US Navy has already tried it and found it wanting.
PS, I may have written this before. I met Adm. Rickover on my submarine’s initial sea trials. I was the on-watch reactor operator. He stood at my right hand in Maneuvering and reached out his hand to the reactor scram switch to initiate a reactor scram drill. I moved his arm away and told him that if he wanted a reactor scram, then he would have to give the order the Engineering Officer of the Watch behind me. That’s what he did. And we conducted the scram drill. My behavior was deemed acceptable. If I had NOT done that, then I would have lost my qualification and probably been ejected from the submarine service. The guy was a freaking anal orifice. Thank God for anal orifices like him – they ensured that the number of surfaces equaled the number of dives, all without computer models. Adm. Rickover went to his reward on July 8, 1986, and now subs are built using computer models. I am glad I am no longer aboard. Freaking computer models – garbage in, garbage out.
Computer modeling and big data in many cases appears to be the modern equivalent of the reading of chicken entrails